The dashboard provides a comprehensive view of financial transactions. It features sections for “Expenses Visualisation” and “Net Cash Flow”, offering insights into income and expenses at a glance.
Each transaction is neatly organized in a table format, displaying the transaction type, nominal value, date, and category for easy reference. The “+ Add Record” button allows for the easy addition of new records, ensuring that all financial data remains current. This dashboard serves as a central hub for managing and understanding personal finances.
Net Cash Flow
The “Net Cash Flow” screen provides a detailed layout of the user's financial status. It prominently features a pie chart that visually represents the proportion of income to expenses. This visual aid is instrumental for quick assessments and informed decision-making, aiding in identifying trends and making future projections.
The screen also displays numerical fields for income, expense, and net cash flow, providing a snapshot of the user's financial health without divulging specific values. The options to navigate through different months and years allow users to track their financial progress over time.
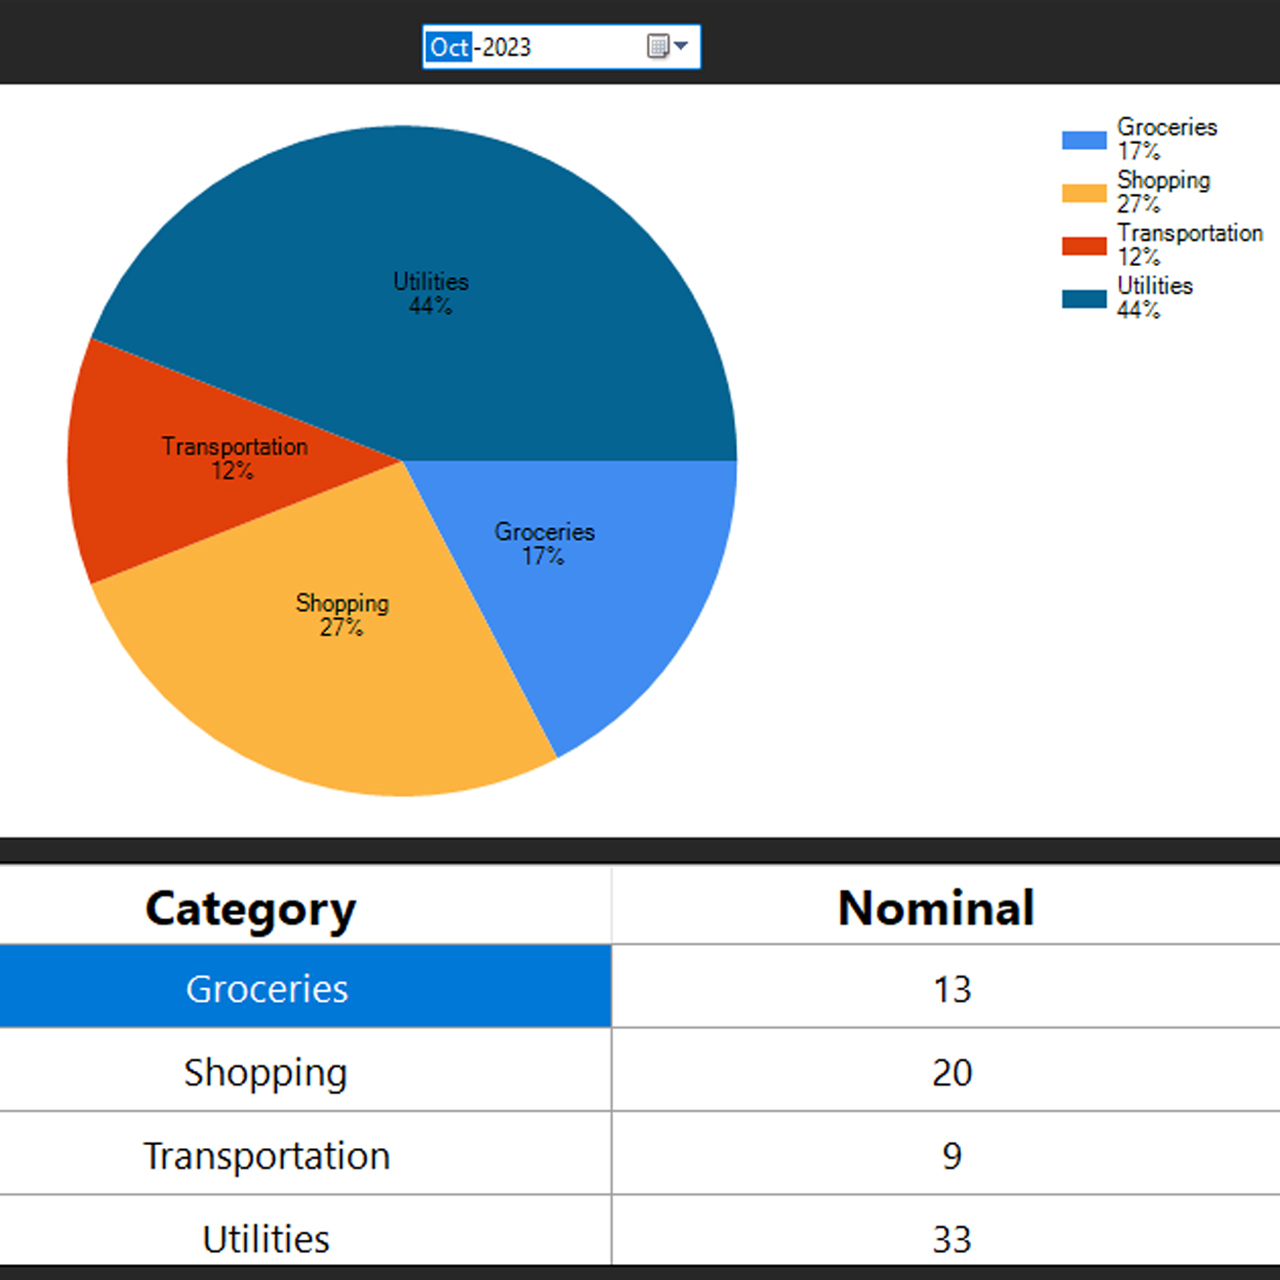
Expenses Visualisation
The “Expense Visualisation” screen offers a detailed breakdown of expenditures. It features a colorful pie chart that visually represents different expense categories, including groceries, shopping, transportation, and utilities etc. This visual aid allows for a quick understanding of the proportion of each category in the total expenses.
Below the pie chart, a table layout provides a breakdown of spending in each category, offering a detailed insight into the expenditure in each area. This screen is an essential tool for tracking spending habits and managing personal finances effectively.